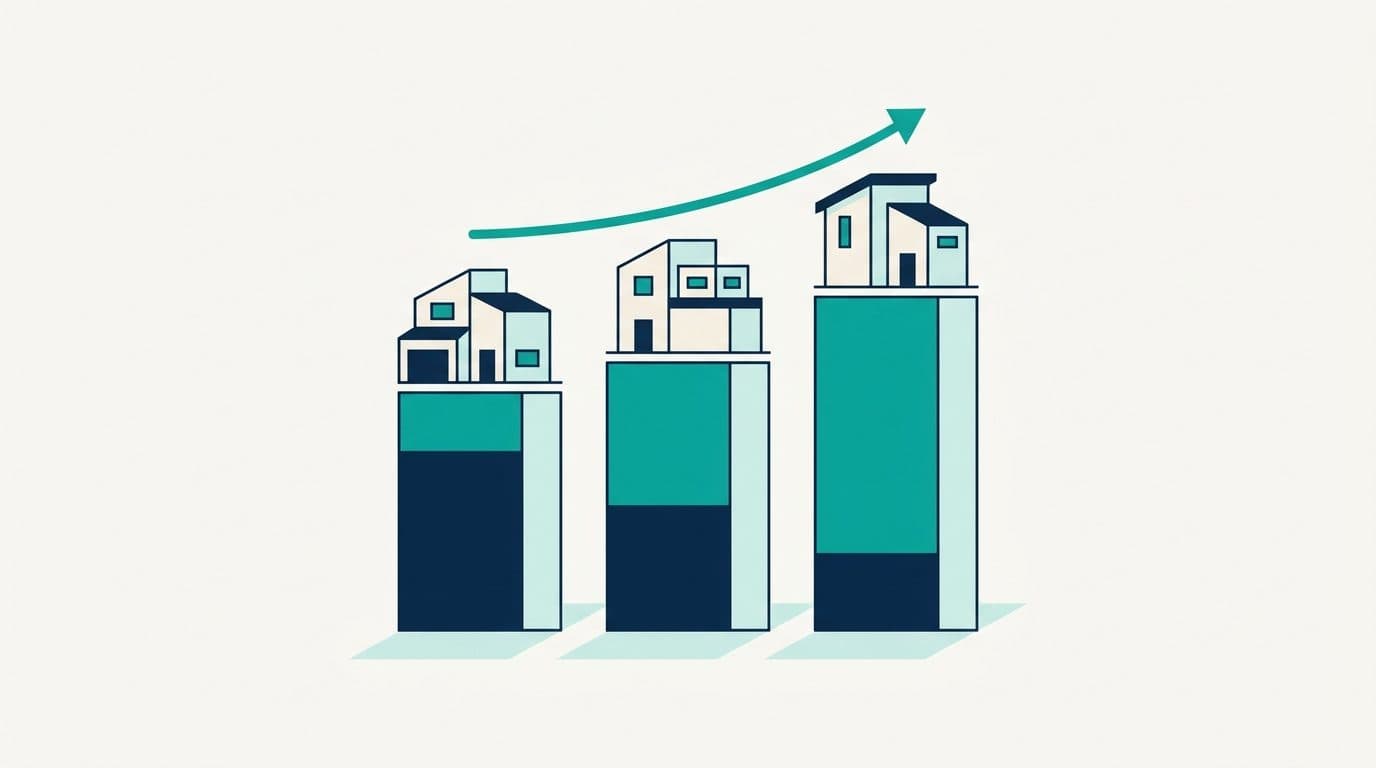
How to Track Your Property Portfolio Like a Serious Investor
Most property investors track what they bought but never their actual position. Here is how to track equity, LVR, cashflow and net worth across your whole portfolio, plus the free tool I built to do it.
Most property investors can tell you what they paid for each property. Far fewer can tell you, off the top of their head, what their portfolio is actually worth today, how much equity they can access, what their real monthly cashflow is after every cost, or whether they are on track to the income they are investing for in the first place.
That gap is where good investors quietly go backwards. You cannot make a confident decision about your next purchase, a refinance, or pulling equity out if you do not have a clear, current picture of where you stand. So let's talk about how to actually track your property portfolio properly, the numbers that matter, and the free tool I built to keep my own portfolio honest.
The numbers most investors never actually see
Buying a property is the easy part. Knowing your true position across several of them is where it gets messy. These are the numbers that should be at your fingertips, and almost never are:
Equity per property and across the portfolio. Current market value minus what you owe. This is the fuel for your next deposit, and most people are guessing at it.
LVR, per property and blended. Your loan-to-value ratio decides what you can borrow, what rate you get, and whether you are exposed if values dip. A property sitting at 88% LVR is a very different story to one at 55%, and your blended portfolio LVR tells the bank how much room you really have.
Net cashflow after everything. Not just rent minus mortgage. Rent minus repayments, rates, insurance, management, and vacancy. The number that is actually landing in or leaving your account each month.
Net worth, and the trend. Total assets minus total liabilities, tracked over time. One snapshot is a number. A line of snapshots is a trajectory, and the trajectory is what tells you if the strategy is working.
Why the spreadsheet always breaks
Almost every investor starts with a spreadsheet. It works fine for one or two properties. Then it quietly falls apart.
Values go stale because nobody updates them. Joint ventures break the maths, because if you own 50% of a property your spreadsheet is probably still counting 100% of the value and the debt. LVR is a manual calculation you stop doing. There is no history, so you cannot see whether you are ahead of where you were six months ago. And the moment your situation gets interesting enough to need real tracking, the spreadsheet is exactly when it stops being trustworthy.
The irony is that the bigger and more valuable your portfolio gets, the more a messy spreadsheet costs you, because the decisions get bigger too.
What I actually track, and why it matters for your next loan
I am a property investor before I am a broker. I own five properties across NSW and VIC, so I track this for myself, not as a theory. Here is why each number is not just nice to know, it directly affects what you can do next.
Equity and LVR decide your borrowing power. When you want to buy again, the bank looks at how much usable equity you have and your overall position. If you know your real equity and blended LVR, you can see your next move before you even call me. If you are guessing, you waste months.
Cashflow decides serviceability. Every dollar of genuine net rental income helps your borrowing capacity. Every cost that you have not accounted for hurts it. Lenders assess this carefully, so you should too.
Net worth trend decides your timing. If your equity is growing and your cashflow is stable, you can move sooner. If a property is dragging, you want to know early, while you still have options.
This is the difference between investors who buy on a clear plan and investors who buy on a hunch and hope.
Meet Compass, the tracker I built for my own portfolio
I could not find a tool that did this the way I wanted, so I built one. It is called Compass. It is private, clean, and built specifically for an Australian property investor. Everything is in AUD. Here is what it does.
A live dashboard. Real-time net worth, total assets, total liabilities, annual income, and monthly cashflow, all calculated from your actual data. A trend indicator shows how your net worth has moved since your last snapshot. A pie chart breaks down your allocation across property equity, cash, metals, brokerage, and super. A line chart tracks net worth over time.
A proper property table. Every property with its market value, debt, equity, colour-coded LVR, rent, repayments, and net cashflow. It handles partial ownership, so if you own 50% of a property every figure scales correctly instead of overstating your position.
Net worth snapshots. Save a dated snapshot any time. Those snapshots power your trend line and your month-to-month progress, so you can finally see the trajectory instead of a single number.
Everything else you own. Bank accounts, precious metals, and superannuation all feed into your totals, so net worth means net worth, not just property.
A rental income goal. Set a passive income target, and the dashboard shows your current progress, the gap, and roughly how many more properties you need to get there. Mine is set to 400k a year, and seeing the gap every day is a very effective motivator.
A scenario planner. Model what happens if you buy more properties over time. It projects how your value, debt, equity, and net worth evolve year by year, with growth and rental assumptions, and shows you when you would be debt-free. This is the part that turns tracking into planning.

How tracking changes the way you invest
When you can see your whole position clearly, the decisions get obvious.
You can see when a property has grown enough equity to fund the next deposit, instead of waiting and guessing. You can spot the property that is quietly bleeding cashflow and fix it, refinance it, or move on. You can tell at a glance whether you are actually on track to your income goal or just busy. And when you do come to buy again, you walk into the conversation with your broker already knowing your numbers, which makes the whole thing faster and stronger.
Good tracking does not just record your investing. It improves it.
Want to use it?
I am giving a small number of property investors free access to Compass. There is no cost. I built it for myself, it has genuinely changed how I run my own portfolio, and I would rather more investors had something like it than have it sit private.
In return I ask for a few details so I can set up your access and, if it is useful, have a proper conversation about your portfolio and where you are trying to get to. No pressure, no spam. Put your details in below and I will get you set up.
Get free access to Compass
The private portfolio tracker I built for my own properties. Enter a few details and I will set you up with access.
Get my free access
Property investor and mortgage broker based in Sydney. Former Mudgee local, owner of five properties across NSW and VIC. I work with clients across Australia on home purchases, refinancing, and investment loans.
Book a Free Chat